Financial Intelligence; Must-Monitor Metrics for Every CFO
The importance of Financial Intelligence reporting is universally accepted. It's a dynamic medium for evaluating the financial health of a business. Additionally, it also serves in decision-making and devising strategies to dodge banana skins and miss opportunities.
However, as a CFO, you're charged with more than financial pulse reporting. So, it's essential to have tools to continually monitor and evaluate your company's revenue and profit and shape the future of the company’s growth.
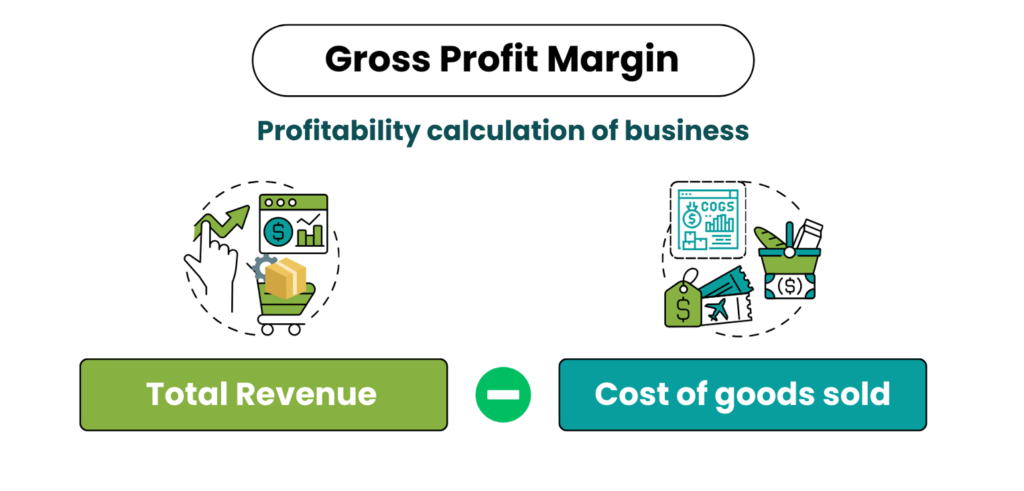
 Gross profit margin is one of the key highlights on a C-level financial dashboard. It measures how much money is left from sales after deducting the cost of goods sold, expressed as a percentage of total sales. A largely fluctuating margin might push you to review your pricing strategy or do cost-cutting to improve profitability.
Gross Profit Margin = (Revenue Gross Profit)×100
Financial Intelligence Performance Indicators; The Nuts & Bolts of Your Business Success.
Financial KPIs are the standards by which a CFO tracks how effectively a company achieves its key objectives. They help you make smart, data-driven decisions, anticipate risks, and build agility in your processes. In any organization, CFO needs defined, actionable KPIs to spot wins and face the challenges head-on. While each company’s unique goals dictate which metrics should be the top priority, the following are among the most important.Quick Ratio
Where long-term potential may look good, your short-term obligations matter for daily success. This CFO KPI enables you to quickly flag the financial pulse of your business. Also, this financial health check is achieved by measuring a company's capacity to satisfy its short-term financial commitments immediately. Quick Ratio = (Cash + Marketable Securities + Accounts Receivable) / Current LiabilitiesCurrent Ratio
A lot can be buried in the receivables and payables totals, and what truly counts is how well these areas are managed. Similar to the quick Ratio, this CFO metric measures a company's ability to track financial obligations. A temperature gauge on whether your financial system and accounting office are on track or falling apart due to solvency issues. Current Ratio = Current Assets / Current LiabilitiesWorking Capital
When big decisions roll in, every CFO needs to know if he has enough capital available or on the way to address big market moves. So, this measurement identifies solvency challenges and whether pushing for expansion could put the company at risk. Working Capital = Current Assets – Current LiabilitiesOperating Cash Flow
The trigger for most business owners is that cash flows move at a different pace from revenue, expenses, and income. Therefore, this value driver measures how much cash is generated from day-to-day operations. For added assistance, it also indicates whether your business has enough to support the foundational tasks. Operating Cash Flow = Operating Income + Depreciation – Taxes + Change in Working CapitalAccounts Payable days
Along with liquidity management, the creditor's cycle is a basic operational performance indicator. While a quick turnover indicates business stability, a slow cycle signals delays due to cash shortages. Days payable outstanding = (Accounts Payable x Days in the Time Period) / Costs of Goods Sold)Cash Conversion Cycle
Useful in cash flow analysis and inventory control, this KPI measures the time to convert the stock back into cash. A long cycle indicates you're sitting on inventory for too long. Neither a state a CFO wants to be in. Cash conversion cycle = Days of Inventory Outstanding + Days Sales Outstanding – Days Payables OutstandingGross Profit Margin
 Gross profit margin is one of the key highlights on a C-level financial dashboard. It measures how much money is left from sales after deducting the cost of goods sold, expressed as a percentage of total sales. A largely fluctuating margin might push you to review your pricing strategy or do cost-cutting to improve profitability.
Gross Profit Margin = (Revenue Gross Profit)×100
EBITDA & EBITDA Growth
Earnings before interest, taxes, depreciation, and amortization quantifies a company's core profitability. Similar to net income, it helps to deduct accounting and financing decisions to make a company's performance more comparable head-to-head. EBITDA = Net Income + Interest + Taxes + Depreciation + AmortizationReturn on Equity
If you're a public corporation, your shareholders must know where their money is going. Consequently, this measures how efficiently a company's capital creates profit for investors and business owners. As a CFO, anticipating such reports is critical as it allows you to take action now for what's coming.Earnings per Share
When it comes to KPIs, nothing captures reporting like EPS. This CFO reporting metric appeals to the investors as it indicates how much their shares earn. With high EPS, your business appears more viable and attractive to the shareholders than lower EPS. EPS = (Net Income – Preferred Dividends)/(End-of-Period Common Shares Outstanding)Debt-to-Equity Ratio
It's easy to lend and generate cash flows via debt for your business, but how is the debt handled? So, this CFO metric compares the business's liabilities to the shareholder equity. A higher ratio indicates the company funds more of its operations through debt, which means higher risk. Debt-to-Equity Ratio = Company's Total Liabilities / Total Shareholder EquityInterest Coverage Ratio
This metric is particularly useful as it provides insights into the financial health of a business from two perspectives. One is the debt level analysis, while the other is the company's profitability. As a result, lenders often use this to assess the level of risk with a loan. Typically, a low ratio signals a low risk, while a high ratio might trigger rejection. Interest Coverage = EBIT/Interest ExpenseCompound Average Growth Rate
All investors are eager to see the company's growth, whether sales or EPS. Generally reported quarterly or annually, the CAGR quantifies how much compound growth a company has achieved over a specific period. CAGR = ((Ending Balance)/(Beginning Balance))^(1/n)-1 Where n is the number of periods over which the growth occurred.Employee Count Ratio
This CFO KPI tracks the number of full-time and part-time employees on the payroll. It helps success metrics on a per-employee basis and highlights how labor costs impact financial health. Furthermore, CFOs may compare how metrics perform between all employee categories to determine which are the most cost-effective. Employee Count Ratio=(Total Number of Employees / Number of Specific Employee Type)×100Physical Carbon Intensity Ratio
This sustainability metric maps out carbon emissions against the physical output of the company. The output may be tons of copper extracted, bushels of corn, or megawatt hours of electricity produced. By monitoring this output, CFOs can track the success of the sustainability initiatives against the actual impact generated. Physical Carbon Intensity Ratio = Tons of CO2 Emissions ÷ Production Units (e.g., gallons of fuel)Weighted Average Carbon Intensity (WACI) Ratio
This tracks total carbon emissions per $1 million in revenue generated by the company. Here, the downside is that revenue fluctuates a lot and varies from company to company. In this case, you may be unable to analyze performance against other businesses. Therefore, instead, focus on your historical performance in similar revenue conditions. WACI = Tons of CO2 Emissions / (Revenue/$1 million)Automation In Key Performance Metrics Tracking
For KPIs to be transformative, they must be aligned with the business strategy and they must be measurable and actionable. Many companies still use manual processes and spreadsheets to follow KPIs. However, the key to achieving the metrics efficiently lies in using automated softwares that eliminates inefficiencies and streamlines processes. Additionally, these offer built-in reporting abilities along with customizable dashboards to keep the CFOs well aware of business health. With tightly monitored processes, you can proactively safeguard against flying blind, severe financial mistakes, and risking missed opportunities.Conclusion
Navigating the financial ecosystem as a CFO can feel like a perpetual battle against the unknown. Luckily, monitoring the right ones can turn things around, offering clarity in your financial strategy. In summary, businesses evolve, and so should your KPIs. Therefore, to avoid potential gaps, cherry-pick the ones that seem the most relevant to your organization's goals and priorities to achieve a sustainable competitive advantage and drive success.Recent Posts
altair0 Comments
Staff Augmentation – Adaptive Staffing for Dynamic Growth
altair0 Comments
Financial Intelligence; Must-Monitor Metrics for Every CFO
altair0 Comments


